
How Have Investments Performed in 2026? A Mid-Year Review of Global Markets

(image created by AI; article written by me)
How Markets Have Fared in the First Half of 2026
Global equities are up around 10–11% in the first half of 2026, with Japan the standout performer at +17% and emerging markets surging +22%, driven by AI hardware exposure in Taiwan, South Korea and China. The US rally has notably broadened beyond the Magnificent Seven, while Bitcoin has fallen 32% and gold has given back some of its exceptional 2025 gains.
We're halfway through 2026, so it feels like a good moment to take stock of how financial markets have fared so far this year. What's performed well, what hasn't, and what might the second half hold?
Please note, when investing, your capital is at risk. The value of your investment (and any income from them) can go down as well as up, and you may get back less than you invested. Past performance is not a reliable indicator of future performance. Investments should be considered over the longer term and should fit in with your overall attitude to risk and financial circumstances.
Scorecard
Here's the 2026 year-to-date (YTD) scorecard, in local currency terms and rounded to the nearest percentage point, across the main asset classes:
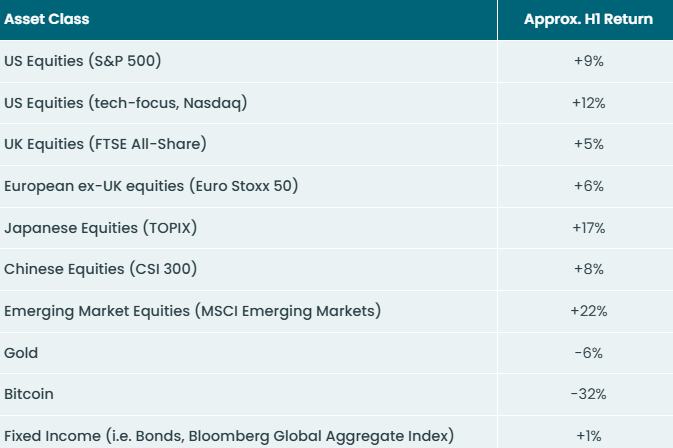
* Source: Market Return Data; returns to 01/07/2026
** For US equities, I've included two benchmarks — the broader S&P 500 and the tech-heavy Nasdaq — to illustrate the continued outperformance of technology within the US market. More on this below.
Equities Outperforming
It's been a solid six months for global equities, up around 10–11% on aggregate. This is also shown in the chart below, in local currency terms (which is why some values differ slightly from the table above):
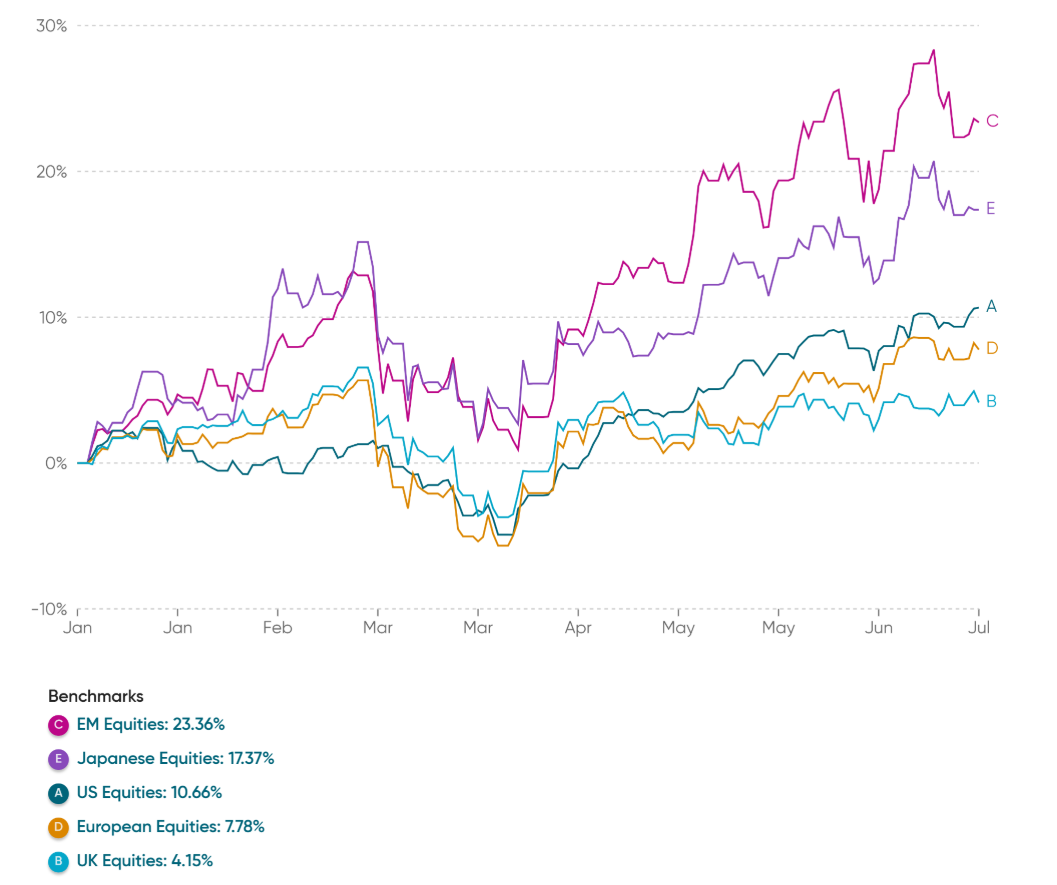
Source: Fintegrate / Morningstar
Looking more closely at each of the major regions:
1. US Equities: Rotation & Revaluation
US equities continue to perform strongly, with the S&P 500 up around 9% in USD terms through the first half of the year. As the chart above shows, this performance has all come in the last two months — US stocks were flat through to April — driven by a strong Q1 reporting season prompting equity analysts to revise their corporate earnings forecasts sharply higher.
That leads to a key point: US valuations (measured by 12-month forward price-to-earnings ratios) have actually come down slightly, from roughly 22x earnings at the start of the year to closer to 20x now:
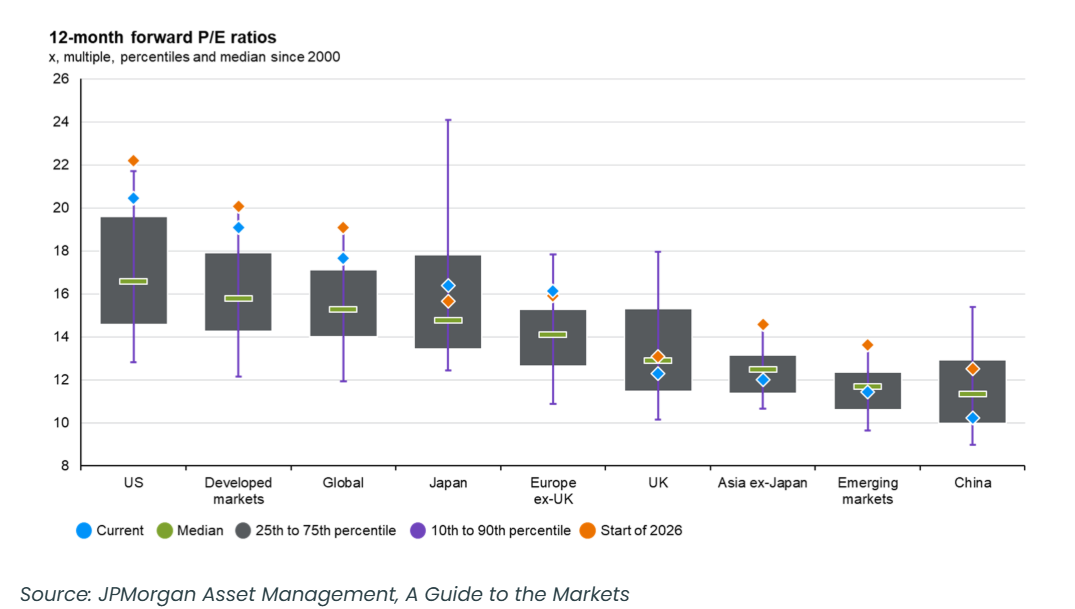
In practice, this means earnings forecasts have risen faster than prices. So while the price (the numerator in the P/E calculation) has gone up, earnings (the denominator) have gone up by more — a healthy dynamic. US valuations remain elevated, but less stretched than they were in January.
The other interesting dynamic is that this year’s rally has not been driven by the "Magnificent Seven" — in fact, they've lagged over the first six months. That's a sharp reversal from recent years, where almost all US equity performance came from those seven tech names (Alphabet, Amazon, Apple, Meta, Microsoft, Nvidia and Tesla).
The chart below illustrates this. So far this year, the Magnificent Seven are broadly flat in aggregate, while the "S&P 493" (the index minus those seven stocks) is up around 15%.

This is one of the main stories of 2026: a return of market breadth, something that's been notably absent in recent years. Market commentators have cited two possible explanations:
The spoils of AI are starting to filter down to the broader economy, benefiting a wider range of companies rather than just the mega-cap tech names.
Growing concern about AI commoditisation and capex overspend (data centres and the like) is weighing on the biggest names specifically.
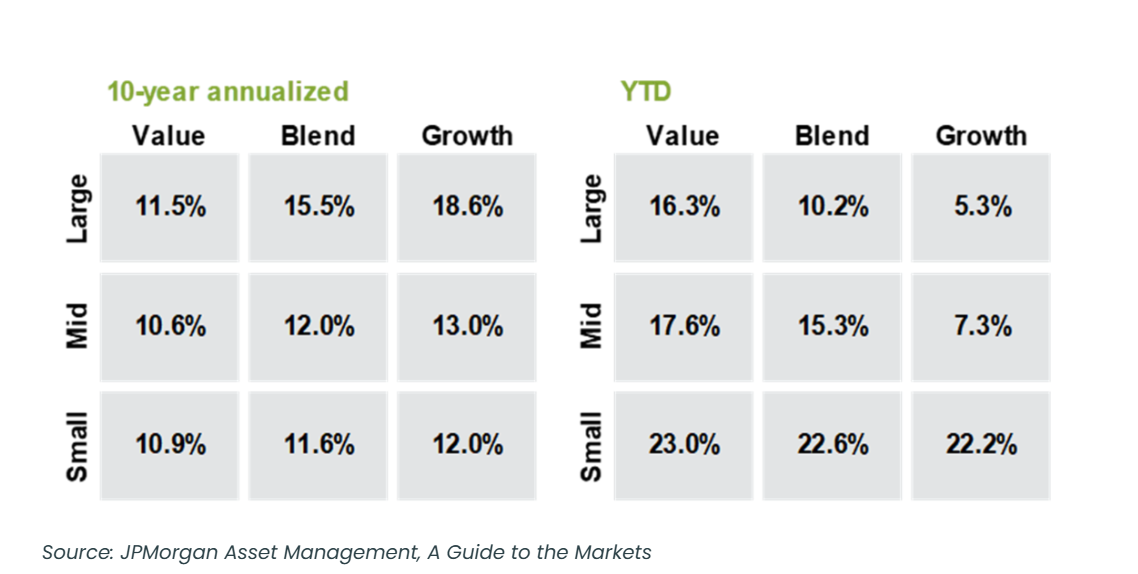
This rotation shows up clearly in the style box below, which plots US equity performance by company size (vertical axis) and valuation (horizontal axis). The left box shows returns over the last ten years; the right shows year-to-date.
As you can see, ten-year performance has been heavily skewed to the top-right — large-cap growth, essentially the US tech mega-caps. Year-to-date, that's inverted, with value and small/mid-cap companies leading instead.
2. UK Equities: Promising Start, Then a Fade
The FTSE All-Share had a good opening quarter. Then the tech and AI narrative reasserted itself globally, and the UK — with its heavy tilt toward banks, energy, miners and consumer staples, and very little tech exposure (under 4% of the All-Share index) — found itself back on the sidelines.
Add a dose of domestic political uncertainty, and the index has essentially gone sideways since mid-January.
3. European Equities: Solid
European equities were among the hardest hit by the war in the Middle East, on fears of an energy-led inflation surge given Europe's reliance on Middle Eastern oil imports. Like the rest of the world, that fear has since eased, prompting a recovery in mainland European stocks.
Less newsworthy than the US or Japan (see below), but a positive contributor to portfolios all the same.
4. Japanese Equities: The Standount
Japan has been this year's story.
The election of a new Prime Minister with an explicitly pro-growth, high-spending agenda has been rocket fuel for Japanese equities. A weaker yen has also helped exporters, and the ongoing corporate governance reform story keeps drawing in foreign capital.
It's always worth remembering Japan spent the best part of three decades going nowhere — this run feels like international investors finally getting comfortable with the asset class again.
5. Emerging Markets: Dispersion
Headline EM numbers look excellent, but they mask a real divergence underneath.
Taiwan, South Korea and China — all deeply embedded in the AI hardware supply chain (chips, memory, servers) — have driven almost all of the gain.
India, by contrast, has been one of the year's biggest disappointments after several years as the market's favourite EM story. The read from investors seems to be that India's growth case leaned heavily on ‘labour arbitrage’ — the world outsourcing tasks to Indian workers — and that AI, specifically agentic AI, threatens that model.
Other Asset Classes
Fixed income has lagged again, as inflation has ticked higher. This puts upward pressure on interest rates and yields, which in turn puts downward pressure on bond prices, since new issuance offers higher yields than existing bonds.
Gold has had a strange year. After an extraordinary 2025 (up roughly 70%) and a further spike to an all-time high in January, it spent the rest of H1 giving some of that back as safe-haven demand cooled and money rotated into risk assets.
Bitcoin has had a rough six months, down sharply from where it started the year.
Cash, meanwhile, has plodded along at a little under 4% annualised — perfectly respectable for money you need in the short term, but a reminder of why we don't build long-term plans around it.
Looking Forward
The backdrop, on paper, looks about as good as it's been for a while.
Inflation appears stable, interest rates have normalised, corporate earnings have been strong — particularly in the US, where Q1 results drove much of this year's rally and, as noted earlier, have been growing faster than share prices — US growth forecasts have been revised upward following the recent tax legislation (Trump’s ‘One Big Beautiful Bill Act’), and there's at least a fragile peace holding in the Middle East. It would be easy to conclude the coast is clear.
Of course, it's never that simple. Shocks aren't called shocks because we saw them coming. To be clear, this isn't a forecast of choppier seas ahead — it's simply a reflection that there's usually a wobble at some point along the way, and I naturally get a little more cautious whenever euphoria seems to be in the air.
One thing worth watching in particular: the US midterm elections in November. Should Trump lose control of the House and/or Senate, he'll enter the second half of his term with reduced legislative leverage, and may find it harder to sustain the scale of fiscal stimulus that's underpinned a lot of this year's growth story. Whether that causes markets to cool, or whether momentum simply carries through regardless, is hard to call.
The key point is that trying to predict short-term market moves is a fool’s errand. Few this year would have predicted a +10% rally in global stocks from mid-March, when war was still raging in the Middle East.
The strategy that's worked for the last twenty-five years remains the same: stay invested, stay diversified, and let time do the heavy lifting rather than timing.
Happy Thursday.
Kind regards,
George
Referrals Welcome
Our business grows mainly through personal recommendations. If you know someone—whether a friend, family member or colleague—who might benefit from financial planning, we’d be grateful if you could share my details with them. Alternatively, you can pass their details on to me, and I’ll be happy to reach out.
Regulatory Information
Blincoe Financial Planning Limited is an appointed representative of Sense Network Ltd, which is authorised and regulated by the Financial Conduct Authority. Registered in England & Wales (No. 14569306). Registered Office: Star Lodge, Montpellier Drive, Cheltenham, GL50 1TY.
Important Disclaimer
This blog is for general information only and is intended for retail clients. It does not constitute financial or tax advice, nor is it an offer to buy or sell any specific investment. Since I don’t know your personal financial situation, you should not rely on this content as tailored advice. While we aim to provide accurate and up-to-date information, we cannot guarantee that all details remain correct over time. We are not responsible for any losses resulting from actions taken based on this blog’s content.