
Asset Allocation vs Fund Selection: What Actually Drives Long-Term Investment Returns?
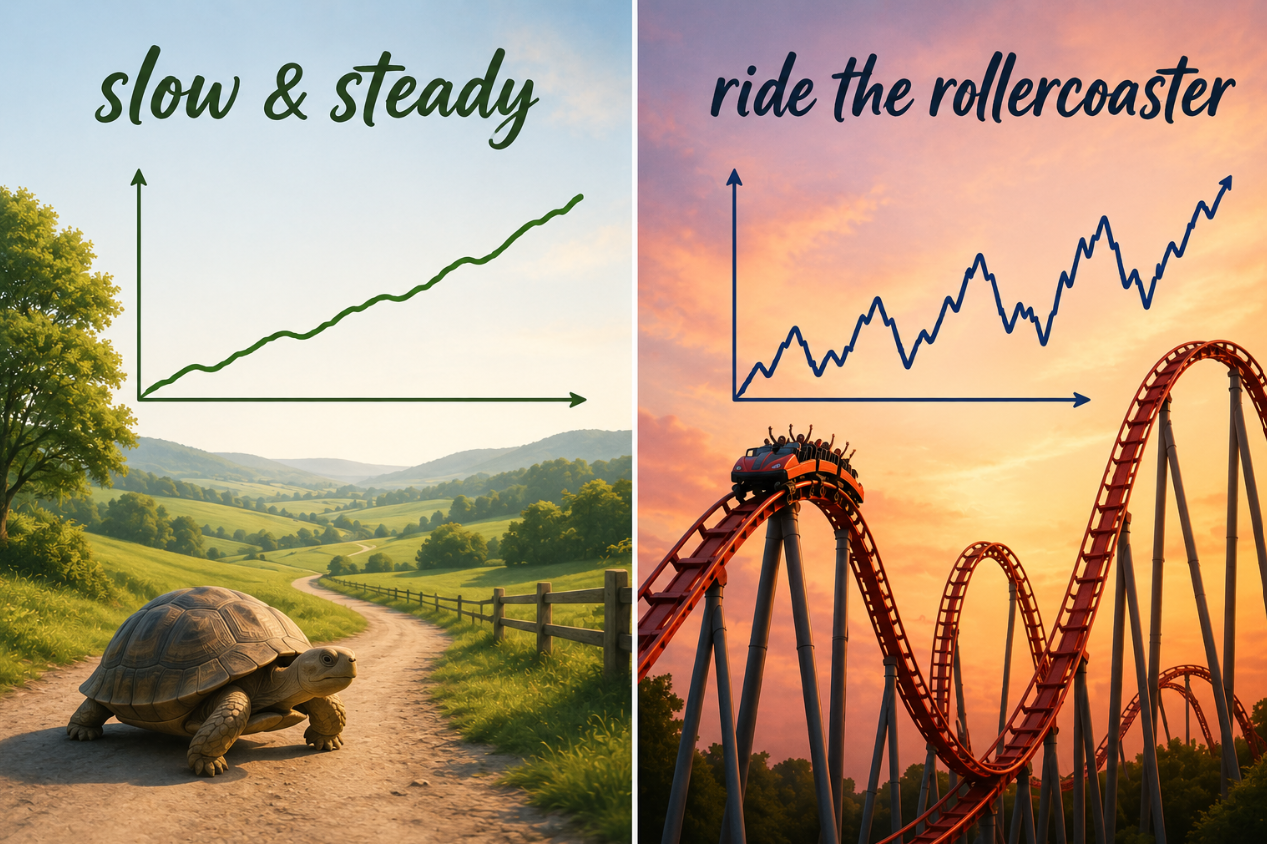
(image created by AI; article written by me)
Asset Allocation: The Boring Decision That Drives Everything
For most investors, the single biggest driver of long-term returns isn't which funds they pick - it's how their portfolio is split between equities, bonds and cash. In this week’s blog we determine the right level of investment risk, how that translates into asset allocation, and what the data shows about the trade-off between return and volatility.
Pick up the money section of any major newspaper and you'll find the usual headlines: which shares look cheap, which funds are outperforming, which markets are due a correction, and so on.
The implicit message is that investment success comes from picking the right investments at the right time. But that is misleading.
Research consistently shows that for most investors, most of the time, the single biggest driver of long-term returns isn't investment selection — it's asset allocation.
In simple terms, asset allocation is the mix of equities, bonds, and cash within a portfolio. Get that mix broadly right, and you're likely to achieve a more appropriate balance between risk and return.
Which brings us to risk profiling. Before deciding how a portfolio should be invested, it's important to establish how much investment risk is appropriate in the first place. That decision will ultimately shape the asset allocation, and therefore much of the portfolio's long-term behaviour and returns.
Determining the ‘Right’ Level of Investment Risk
Arriving at the ‘right’ level of investment risk involves a discussion around three factors:
1. Your ability to take risk
The first is your capacity for risk — your ability to withstand short-term market falls without it derailing your financial life.
Two things primarily determine this:
Your broader financial position: do you have surplus income comfortably covering your outgoings? Are you holding meaningful cash reserves that mean you're not reliant on your investments for day-to-day needs? The more financial resilience you have around your portfolio, the more short-term volatility you can absorb without it impacting your lifestyle.
Time: A longer investment horizon — whether that's decades to retirement or a lengthy drawdown period — gives you more capacity to ride out falls and wait for recoveries. Time, in effect, is a buffer.
2. Your willingness to take risk
The second factor is more subjective: your tolerance for risk, or your psychological comfort with the volatility that comes with investing.
We use risk questionnaires to help gauge this, though they have their limitations. The best measure of true risk tolerance is how you felt when markets were actually falling — the Covid sell-off of 2020, the Trump tariff shock of 2025, or the global financial crisis of 2008-09. Did you stay the course, or did those periods leave you anxious and questioning everything?
This matters enormously, because the biggest investment mistake most people make isn't choosing the wrong fund. It's panic-selling at a market low — locking in losses just before a recovery that would have repaired the damage.
As the financial planner Andy Hart puts it: "the best portfolio is the one you'll stick with."
3. Your need to take risk
The third factor is one that often gets overlooked: how much risk do you actually need to take in order to achieve your goals?
We explore this through cashflow modelling, projecting your future financial position to then reverse-engineer a required annual return (to meet your aspirational goals), which in turn helps us assess how much investment risk is actually necessary.
For most clients, we identify at least a medium need for investment risk, simply because most people want to protect the real value of their wealth over time, i.e. to grow at a rate that at least keeps pace with inflation. Cash deposits, over the longer-term, are unlikely to do that reliably.
For others, particularly those who have accumulated significant assets relative to their spending needs, the required return may be surprisingly modest — and that has real implications for how much risk they need to carry.
The three factors don't always point in the same direction
One of the challenges is that these three factors often pull in different directions.
Take a client who has built up substantial wealth over a long career: they likely have a high capacity for risk but a low need for it, because their goals are already well funded. Another client might have a strong stomach for volatility but a life situation that limits how much short-term risk they can realistically absorb.
Navigating that interaction is, in our view, the most important part of investment advice — and the most underappreciated. The end portfolio in terms of fund selection, regional weightings, and so on, is increasingly commoditised. There are plenty of good off-the-shelf solutions, and the value added at that level is limited. Where genuine value lies is in ensuring you're taking the right level of risk in the first place, keeping costs low, and in optimising for tax (a separate discussion altogether).
That also means helping clients understand that short-term volatility isn't a flaw in the system — it's an inherent feature of it. Regular readers will be tired of this message, but markets typically experience a fall of 10% or more every single year, and something more severe every four or five years. Risk is simply the admission ticket for superior long-term returns.
Our job is to find the level at which you can stay invested through the difficult periods, and in doing so, capture what long-term, disciplined investing has historically delivered.
Of course, the usual caveat: when investing, your capital is at risk. The value of your investment (and any income from them) can go down as well as up, and you may get back less than you invested, particularly when investing for a short timeframe (we usually recommend a horizon of at least 5 years). Neither simulated nor actual past performance is a reliable indicator of future performance.
From Risk Profiling to Asset Allocation
Once we've agreed on an appropriate risk profile, that assessment directly informs the asset allocation of the portfolio. We use a 1–10 risk scale, where the number corresponds directly to the equity weighting in the portfolio. For example:
A risk level of 10 implies a 100% equity portfolio
A risk level of 8 implies an 80/20 equity-to-bond split
A risk level of 6 implies a more balanced 60/40 position
Which brings us to the key question: what has that actually meant, historically, in terms of real-world returns and volatility?
What does moving up the risk spectrum actually mean in practice?
To illustrate the real-world impact of asset allocation, we've constructed three model portfolios using two well-established industry benchmarks: the IA Global Index as a proxy for equities and the IA Global Bond Index as a proxy for bonds. These indices are maintained by the Investment Association using data provided by Morningstar, and reflect average performance across funds with similar mandates.
The three allocations — 100% equity, 80/20, and 60/40 — represent progressively more cautious approaches to investing, broadly consistent with our Risk Profiles 10, 8 and 6 respectively.
We've used these custom benchmarks rather than actual multi-asset funds or model portfolios because most of those solutions post-date the global financial crisis, whereas the indices allow us to look back far enough to include it. As we'll show, that period remains the most severe stress test in recent times.
Chart 1: Long-term cumulative performance (20 years)
The first chart compares the long-term performance of the three allocations:
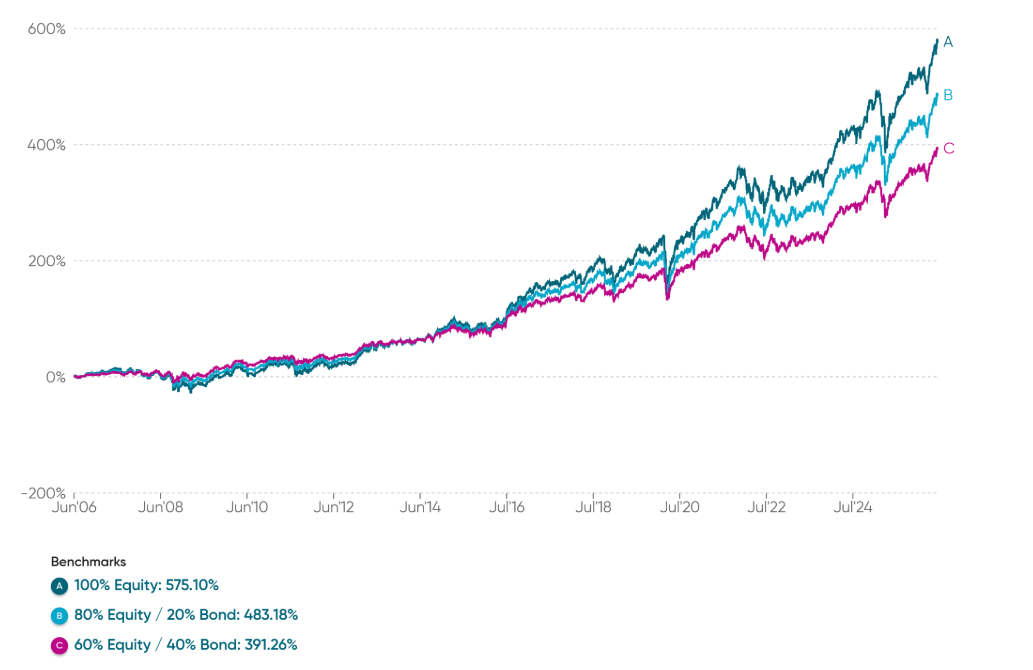
The results tell a clear and predictable story.
Over the past 20 year:
The 100% equity allocation has delivered a cumulative return of 575%, equating to an annualised return of approximately 10% per year.
The 80/20 portfolio has returned around 9.2% per year, and
The more balanced 60/40 split approximately 8.3% per year.
In other words, for roughly every 20% increase in equity allocation, you gain an additional 0.8–0.9% in annual return. That figure is broadly consistent with what financial history has shown us over much longer periods.
It reflects a long-standing relationship: equities represent ownership of businesses, and over the long run, businesses grow and create value. Bonds, by contrast, are loans — more predictable, lower risk, and therefore lower returning. They serve as a stabiliser within a portfolio rather than a growth engine.
To make this more tangible, consider someone saving £10,000 a year over 30 years:
At 8.3% per year, the portfolio will grow to approximately £1.2 million,
At 10% a year, it reaches closer to £1.6 million.
The conclusion is simple: a higher equity weighting implies higher long-term returns, and over a long horizon, a seemingly modest annual uplift — 1.7% per year in this example — can compound into a substantial difference (+£400,000 or 33% based on the figures above).
It’s important to caveat that these figures are based on historic returns, and past performance is no guarantee of future results. They also make no allowance for charges — investment costs, platform fees, and advice fees will all reduce the net return in practice.
But higher returns don't come for free. The other side of the coin is additional volatility — which we turn to next..
Chart 2: Maximum drawdown & recovery period
This second chart uses the same benchmarks but ‘zooms in’ on the Global Financial Crisis of 2007-09:
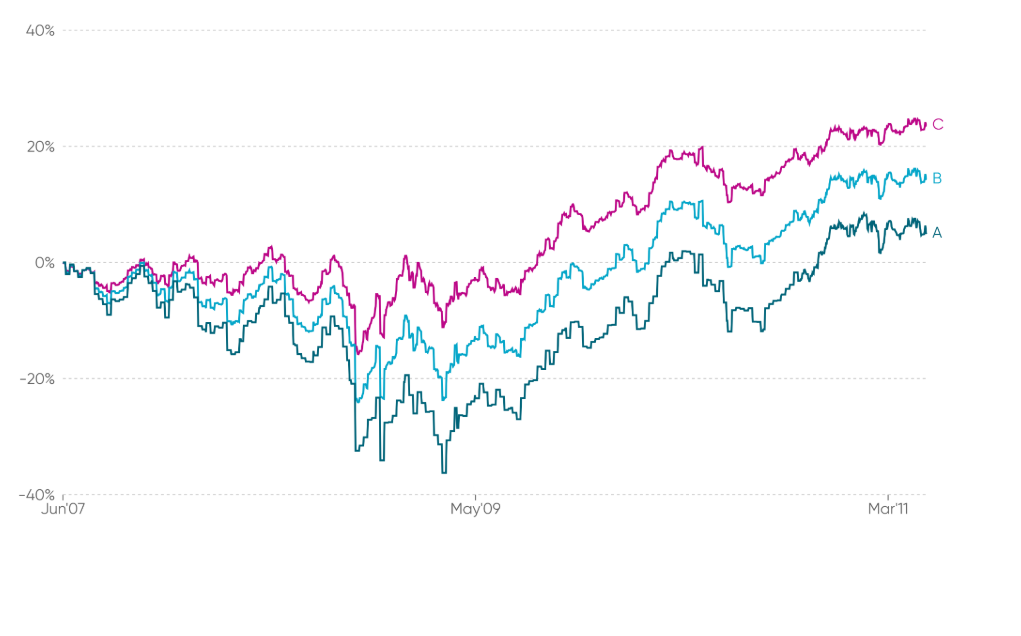
June 2007 marked approximately the pre-crisis market high. What followed — over the next 18 months — was the most severe financial shock of the modern era: the collapse of Lehman Brothers, the near-failure of the global banking system, and a market decline that tested the resolve of even the most experienced investors.
Looking at our three model portfolios during that period:
The 100% equity allocation fell by approximately one third from peak to trough.
The 80/20 portfolio declined by around 23%.
The more balanced 60/40 split fell by ‘only’ around 16% at its worst (i.e. roughly half the decline of the Risk Level 10 portfolio).
The recovery trajectory was equally telling:
The more defensive 60/40 portfolio returned to its pre-crisis level within a year.
The 80/20 split took roughly two and a half years to reclaim its previous high.
The fully invested equity portfolio took the best part of three years.
It's worth reflecting on those numbers. If your portfolio had fallen by a third — say if £300,000 had become £200,000 in the space of 18 months — would you have stayed the course? At the time, the financial press was catastrophising daily. There was no obvious bottom in sight. The temptation to sell, to stop the bleed, to move to cash, was compelling. Those who succumbed locked in their losses at the worst possible moment and missed the recovery entirely. Those who stayed the course were rewarded (eventually).
Summary
Most investment commentary focuses on fund selection and market timing. In reality, asset allocation — the split between equities, bonds, and cash — is the primary driver of long-term returns. Getting that split right starts with risk profiling: assessing your capacity to take risk, your tolerance for volatility, and your need to take risk to meet your goals. These three factors don't always align, and navigating the tension between them is one of the most valuable things a financial planner can do (in our view, at least).
Using IA index data going back 20 years, every additional 20% in equity allocation has historically added around 0.7–0.8% per year to portfolio returns. That may sound modest, but compounded over the 20–30 year horizons typical of most of our clients, the cumulative impact on wealth can be substantial.
But that premium comes with greater volatility. In the example shown, during the most severe downturn of the modern era — the Global Financial Crisis of 2007-09 — the fully invested portfolio fell by a third, versus 16% for the more balanced 60/40 allocation.
The right level of risk isn't simply the highest one. It's the one you'll stick with through good times and bad.
Happy Thursday.
Kind regards,
George
Referrals Welcome
Our business grows mainly through personal recommendations. If you know someone—whether a friend, family member or colleague—who might benefit from financial planning, we’d be grateful if you could share my details with them. Alternatively, you can pass their details on to me, and I’ll be happy to reach out.
Regulatory Information
Blincoe Financial Planning Limited is an appointed representative of Sense Network Ltd, which is authorised and regulated by the Financial Conduct Authority. Registered in England & Wales (No. 14569306). Registered Office: Star Lodge, Montpellier Drive, Cheltenham, GL50 1TY.
Important Disclaimer
This blog is for general information only and is intended for retail clients. It does not constitute financial or tax advice, nor is it an offer to buy or sell any specific investment. Since I don’t know your personal financial situation, you should not rely on this content as tailored advice. While we aim to provide accurate and up-to-date information, we cannot guarantee that all details remain correct over time. We are not responsible for any losses resulting from actions taken based on this blog’s content.