
Sequencing Risk in Retirement Explained: Why the Order of Investment Returns Can Make or Break Your Plan

(image created by AI; article written by me)
Why the order of returns matters
Sequencing risk — the danger that poor market returns in the early years of retirement can permanently derail an otherwise sound plan — is one of the most underappreciated risks in retirement planning. This blog uses stochastic cashflow modelling across 841 historical simulations to show its full impact, and outlines six strategies to manage it.
It remains one of the most important, yet often overlooked, risks for those at or approaching retirement. A run of disappointing market returns in the early years of your retirement can seriously undermine a plan that otherwise looked robust.
To show its full extent, we use stochastic cashflow modelling — overlaying one’s current position with actual historical inflation and asset return data — to map the range of potential outcomes: under 'normal' market conditions, exceptional ones, and stressed ones too.
We then look at some of the options available to help mitigate it.
When investing, your capital is at risk. The value of your investment (and any income from them) can go down as well as up, and you may get back less than you invested. Neither simulated nor actual past performance is a reliable indicator of future performance. Investments should be considered over the longer term and should fit in with your overall attitude to risk and financial circumstances.
A Primer on Cashflow Modelling
To recap, cashflow modelling combines your current financial position with a range of assumptions — income, spending, retirement date(s), inflation, investment returns, and so on — to project that position into the future.
It provides a visual 'roadmap', helping to answer the key question: are you on track to have enough, in income and accessible capital, to meet your desired lifestyle, quantified into a future spending target?
Traditional cashflow models typically take a deterministic approach, assuming that investment returns and inflation are constant (that is, 'linear') across the entire projection — inflation might be set at 3% a year, say, with investment returns somewhere between 4% and 7% a year depending on risk profile.
This produces a tidy single-line graph and a binary 'yes or no' answer: are you on track, or not?
For younger clients, still in the accumulation phase, that simplified view is perfectly adequate — often all you need is a sense check on your trajectory towards financial independence. It is also a useful tool for wealthier clients looking to quantify surplus capital for estate planning or gifting: by identifying what is truly excess, you can give with confidence, knowing your own needs remain secure.
For those on the cusp of retirement, though — where the margin for error is slimmer — this linear thinking falls short. The reality is that financial markets and inflation are volatile, fluctuating significantly from one year to the next. And it is the order in which those fluctuations arrive that introduces a particular danger.
Understanding the Danger of Sequencing Risk
Sequencing risk is the hazard that poor market performance during the early years of drawdown can rapidly deplete your capital. History provides a stark illustration.
Consider a retiree in the year 2000. They faced the bursting of the dot-com bubble, followed soon after by the Global Financial Crisis. Compare their experience to someone retiring in 2010, who went on to enjoy an exceptional fifteen-year bull market. The difference in their long-term outcomes is profound.
The reason the order of returns matters so much for retirees is that market volatility is magnified once you are actively drawing an income. While you are still saving, a market dip can even work in your favour — it lets you buy assets at lower prices, and as long as markets eventually recover, your long-term plan remains intact.
But in retirement, a downturn can turn you into a 'forced seller'. By withdrawing money when prices are low, you permanently lock in those losses, leaving fewer assets to participate in the eventual recovery. That is sequencing risk: a bad start can have a devastating ripple effect on your lifetime wealth.
Capturing the Risk: Stochastic Modelling
To capture this risk, we turn to ‘stochastic’ cashflow modelling.
Instead of relying on static averages, we overlay your current position with actual historical inflation and asset return data going back to 1915.
We model to age 100 — a conservative life expectancy, but one that captures some headroom for longevity risk and any additional costs in later life.
Say you are 50 years old, implying a 50-year timeframe to assumed life expectancy. Simulation 1 runs from January 1915 to January 1965 — that is, it shows how your plan would have fared had it 'lived' through this period. Simulation 2 runs from February 1915 to February 1965. And so on, right up to the present day.
Modelled investment returns are tailored to your risk appetite. A 'Risk Profile 7', for example, would be modelled on a 70% equity and 30% bond allocation.
The result is a 'fan chart', showing the full range of outcomes — that is, projected capital — had your plan started at the beginning of every possible month since 1915.
From there, we can analyse the range of most likely outcomes, the best and worst cases, and the overall probability of 'success' — that is, of having enough.
As ever, this is best demonstrated by way of an example.
A Practical Illustration: Rose’s Story
Rose, aged 58, wants to know if she can afford to retire at 60. Her current financial situation is summarised below:
A mortgage-free home valued at £1 million
A £600,000 pension pot that she has not yet accessed
£300,000 in Stocks & Shares ISAs
A £150,000 general investment account
£50,000 in Premium Bonds for emergencies
Current annual income of £200,000
Full State Pension entitlement, payable from age 67
Target spending of £5,000 monthly (assuming a 1% annual real-term reduction, as Rose gradually transitions to a more ‘passive’ lifestyle over time)
Our stochastic projection for Rose is detailed in the chart below.
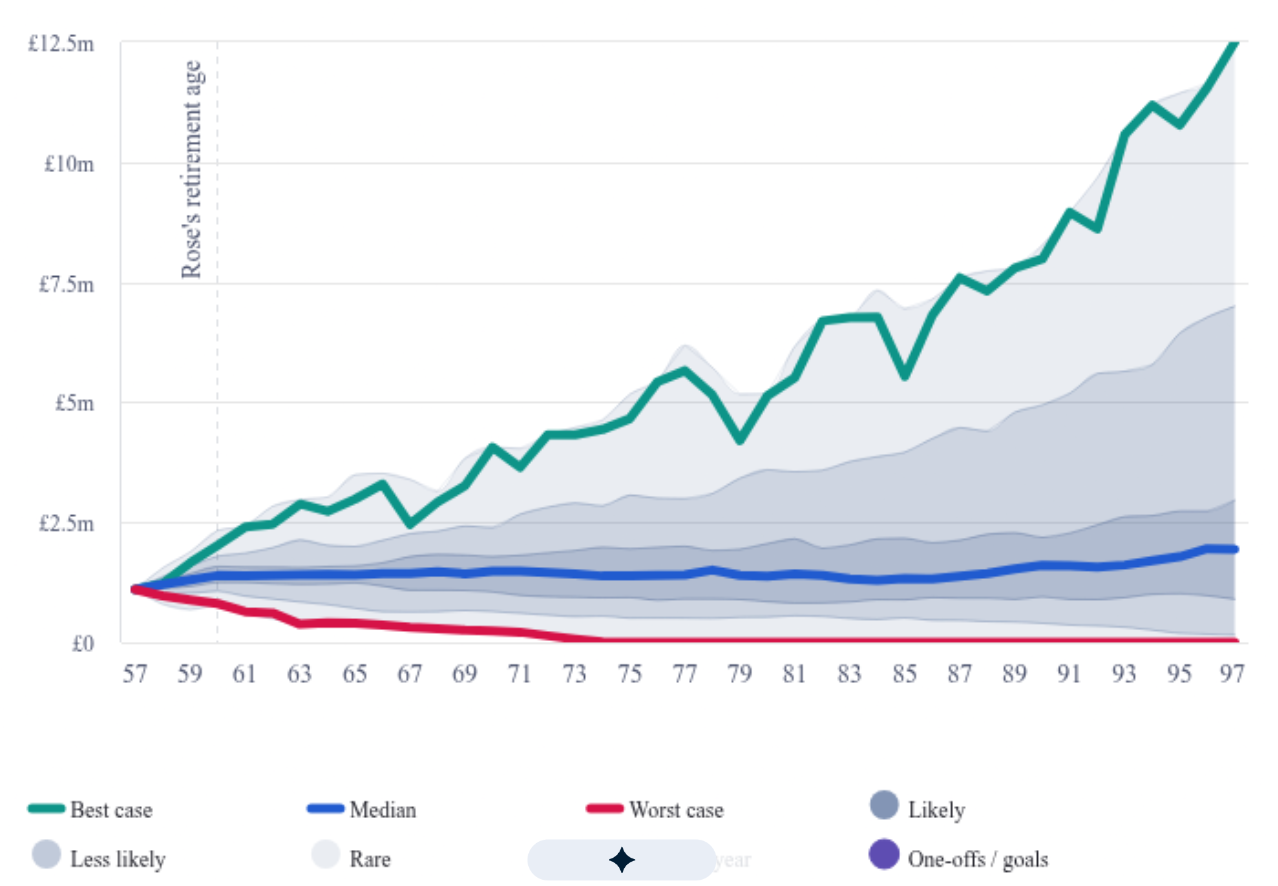
This data highlights the powerful influence of return sequencing. The key points are as follows:
Based on actual historical inflation and asset return data, Rose's overall probability of success is 92%. That is, in 777 of the 841 simulations run, she would have had enough income and accessible capital to sustain her £5k a month spending needs through to age 100. It is worth noting, too, that this rests solely on her liquid capital — it excludes her unencumbered property equity of £1 million. More on this shortly.
In the median (or 'middle') simulation, she would have ended with around £1.9 million in liquid capital, in today's prices, at age 100.
Across the range of 'most likely' scenarios — those between the 30th and 70th percentiles (i.e. the middle 40%) — her liquid capital at age 100 is projected at between £900k and £3 million.
Across the range of 'less likely' scenarios — between the 10th and 90th percentiles — that range widens to between £155k and £7 million.
In the absolute best case, which ran from January 1981 to January 2021, she would have been left with £12.5 million.
In the absolute worst case, she would have depleted her liquid assets by age 75.
This range of outcomes is also presented in the table below:
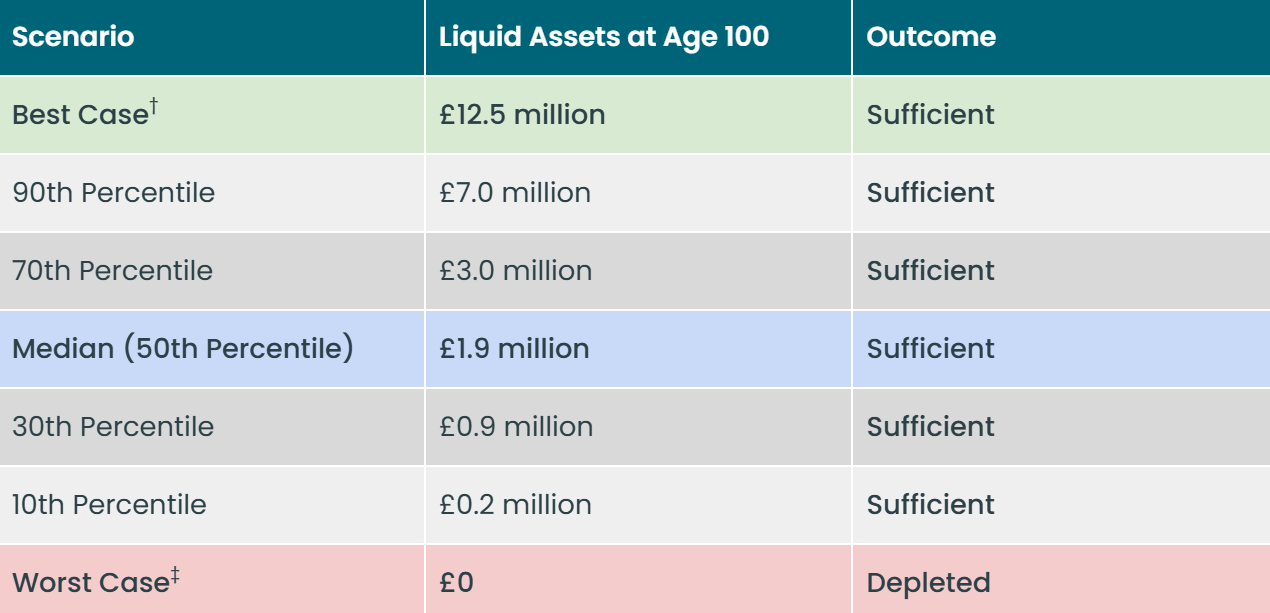
If we set aside the 'long tails' — the best and worst cases, which are extremely rare — the gap between the 10th and 90th percentiles is still extraordinarily wide: some £6.8 million in today's prices.
This disparity shows how the unpredictable interaction of inflation and returns over half a century can, through the power of compounding, lead to vastly different levels of wealth.
You might reasonably ask whether such a wide range of results makes the modelling pointless. We would argue the opposite: it is essential. It strips away the illusion of certainty offered by deterministic models, which can lull us into a false sense of security by ignoring the very real risk of poor market timing.
Strategies to Mitigate the Risk
The good news is that sequencing risk is a manageable challenge. Here are six ways we address it:
1. Plan for the Worst-Case Scenario
This provides considerable peace of mind. Many of our clients find that, even in the most difficult historical simulations, their plan still succeeds — a 100% success rate.
This can never be guaranteed, of course. One might argue that a 110-year sample — the span of inflation and investment return data we use — is relatively small, when set against a 30-year-plus forward-looking horizon. But it remains the best guide we have to what the future might hold.
2. Diversify
Spreading investments across thousands of global companies and a range of asset classes means that when one area falters, another may thrive. This broad exposure is one of the most effective ways to dampen volatility.
It is already embedded in our clients' plans, and in the example above — so much so that it almost goes without saying.
3. The ‘Guardrails’ Approach
This is our preferred strategy.
By setting a spending level with an 80% historical success rate, you balance the risk of running out (of liquid capital) against the risk of missing out (on life's adventures, or on helping loved ones, through unnecessary under-spending). We label this ‘RORO vs ROMO’.
That spending target is reviewed annually, and on any major change in circumstances or economic conditions. And it is dynamic: if markets perform well, you take a pay rise; if they perform poorly, a modest pay cut, to reduce the impact of selling at a loss.
We will be revisiting this topic in the coming weeks.
4. Strategic Annuity Purchase
Another strategy we like, which effectively narrows the range of projections, is to secure some guaranteed — and partly inflation-linked — income through an annuity.
This provides an income floor that is no longer exposed to the vagaries of financial markets: in essence, buying out the risk of running out, leaving the remaining pot of investments and pensions solely to meet discretionary spending and estate planning goals.
5. The ‘Retirement Cash Cushion’
This builds on the 'bucketing' approach to retirement income we have outlined previously. The idea is, at the point of retirement, to ring-fence, say, 18 to 24 months of your spending shortfall — the gap between regular outgoings and guaranteed income — in cash and cash equivalents.
This pot is drawn upon when markets have an intermittent wobble, then topped up again once they have recovered. It offers valuable protection against sequencing risk in the early years of retirement, when that risk is at its greatest.
6. Property as a Financial Safety Net
Finally, and this is often overlooked, you might treat your property as a financial safety net.
Returning to Rose's example, she had a 92% success score — but that was based on liquid capital alone: the cash, investments and pensions that can be accessed and actually spent. Beyond this, she has £1 million in property equity that could be released if needed, through a future downsizing or through borrowing.
So even in the unlikely event that her liquid reserves were depleted, she could comfortably close any shortfall by releasing some of that equity.
Summary
Deterministic cashflow modelling has its uses, but it falls short where it matters most: markets and inflation are far from linear. The sequence of returns is a powerful factor in its own right, and over a long timeframe it can produce vastly different levels of projected future wealth.
Sequencing risk — the risk of poor returns early in retirement — can derail an otherwise sound plan, and Rose's example shows just how powerful that effect can be, with projected capital ranging from £0.2-7.0 million between the 10th and 90th percentiles of all simulations run.
The reassuring news is that sequencing risk can be managed. There are several strategies to draw on, as we have set out above — and our preferred one, the guardrails approach, is a topic we will return to in the coming weeks.
Happy Thursday.
Kind regards,
George
Referrals Welcome
Our business grows mainly through personal recommendations. If you know someone—whether a friend, family member or colleague—who might benefit from financial planning, we’d be grateful if you could share my details with them. Alternatively, you can pass their details on to me, and I’ll be happy to reach out.
Regulatory Information
Blincoe Financial Planning Limited is an appointed representative of Sense Network Ltd, which is authorised and regulated by the Financial Conduct Authority. Registered in England & Wales (No. 14569306). Registered Office: Star Lodge, Montpellier Drive, Cheltenham, GL50 1TY.
Important Disclaimer
This blog is for general information only and is intended for retail clients. It does not constitute financial or tax advice, nor is it an offer to buy or sell any specific investment. Since I don’t know your personal financial situation, you should not rely on this content as tailored advice. While we aim to provide accurate and up-to-date information, we cannot guarantee that all details remain correct over time. We are not responsible for any losses resulting from actions taken based on this blog’s content.
Start here
Wondering if we'd be a good fit?
Answer a few short questions about your situation. If it looks like we can help, you can book an introductory call with one of our planners at the end.
See if we're a good fitTwo minutes. No obligation.